
As I was galavanting through the streets of X (formerly Twitter), I ran across a tweet by Alili Nelly who, if my afande skills serve me right, is the founder of Zidallie. The tweet touched on the expectations of Kenyan employees and employers. It was hilarious and tragic at the same time the paradox of life in Nairobi’s startup scene.

Being a dude who enjoys reading internet strangers’ thoughts and judging them (silently and harshly, of course), I dove into the replies and quotes. The one that intrigued me the most came from Chepsi, who shared their own experience as an employee:
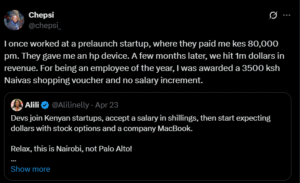
Now that? That’s a horror story. But one I’ve heard before. Many times.
Having worked in people data analytics, I’ve sat in rooms where employees were discussed purely as costs. To put it bluntly you, the employee, are just another row on an Excel sheet. My job was to track your existence, attach a few data points to your name, and prepare presentations that helped management “optimize” you.
So, how does a company go from raising a million dollars to rewarding the MVP of the year with a supermarket voucher? How does a dev accept a 80K pm salary and think they’re getting Apple stock next month? Let’s take a little walk behind the scenes into the minds of founders, budget sheets, and why your paycheck may never match your potential.
Are you a cost or a revenue generator?
Here’s the cold truth: businesses typically spend around 30% of their total revenue on payroll. In some industries like manufacturing, that figure can balloon to 60% or more. So, if your employer finds a way to reduce your cost and extract more value from you? Best believe they’ll take it in a heartbeat.
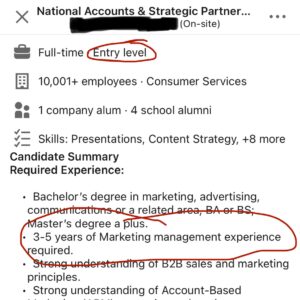
That’s why they’ll post job ads asking for entry-level candidates with 5 years of experience they want to pay entry-level, but get the skill and output of a seasoned employee. That’s why they hire interns with ridiculous expectations and pay them in tea and mandazi (which, funny enough, they also see as a cost to reduce).
Understanding where you fall as an employee is crucial especially before signing that contract. In most businesses, there are generally two categories of employees:
Let’s use Zidallie Nelly’s startup offering safe and reliable school transportation as an example.
-
Revenue Generating Employees
At Zidallie, the revenue-generating employees are the ones directly involved in bringing in money. That includes:
- Drivers – They move the kids from point A to B, which is the core service Zidallie charges for.
- Sales Agents – The folks hustling to onboard schools, parents, and partners so that Zidallie has customers in the first place.
If we were to group them by department, the Fleet team and the Sales department are directly linked to revenue.
-
Cost Center Employees
At Zidallie, a revenue-draining employee might be someone like me, say Nelly hired me as a people data analyst. My job would be to analyze driver performance, flag underperformers, and maybe even recommend who to let go based on their impact on revenue. I wouldn’t be generating revenue. I’d be supporting the people who do.
Other examples of support roles? Finance, HR, compliance, admin, all absolutely essential, but they don’t bring in cash directly. In accounting terms, we’re called a cost center and cost centers are always under pressure to do more with less.
From an employer’s perspective, the goal is simple: have more people bringing in money than draining it. Personally, I like to recommend a ratio of 4 revenue-generating employees for every 1 cost center hire. That way, the business can stay lean while still running smoothly.
So, that brings us to the next big question:
How do employers actually decide what to pay you?
What’s your Worth?
Let’s face it: you don’t get to decide your worth, your employer does. The more desperate you seem, the more you’re at risk of being undervalued. I didn’t invent the system.
And when a company hires you, they’re not just thinking about the salary you’re celebrating. There’s a hidden invoice stapled to your name. Let’s unpack the underlying costs.
Here’s what your employer is actually paying for:
- Monthly Gross Salary – the figure you get on your employment offer/
- Laptop or Equipment – probably a used HP, not a MacBook. Costly all the same.
- Medical Insurance – SHA at a minimum, sometimes private insurance on top.
- NSSF (Employer Contribution) – 6% of your salary, matched by the employer.
- Housing Levy – employers in Kenya now contribute 1.5% of your salary to the Housing Fund.
- Training & Onboarding – even if it’s just a crash course in email etiquette.
- Office Costs / Remote Setup – desks, coffee, internet bundles, or WFH stipends.
- Compliance Costs – KRA paperwork, labour contracts, NITA levies, etc.
- Annual Leave + Sick Days – they’re paying you even when you’re not working.
- Exit Costs – severance pay, legal compliance, notice period payouts, etc.
- Indirect Costs – like office party costs.
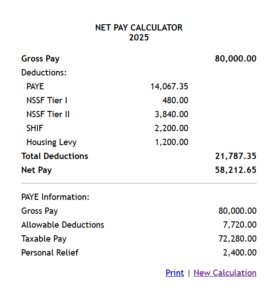
Let’s use Chepsi’s payslip to show how his former employer valued him. He was earning a gross salary of KES 80,000 per month. But in today’s market, his net take-home would be around KES 58,212.65.
Where did the other 27% of his salary vanish to? Statutory deductions and PAYE.
So far, we’ve only looked at Chepsi’s side. But what about the backend? What did it actually cost to maintain him as an employee?
This is where Nelly steps in. If Nelly wants to hire someone like Chepsi in her company, she’s not just paying the salary. She’ll also be footing additional hidden costs that most employers don’t mention at the interview. Let’s unpack that next.
For the sake of making the math simpler we will only calculate the onboarding fees and monthly maintenance:
Employer Payroll Contributions:
- Affordable Housing Levy Employer Contribution: KES 1,200.00
- National Industrial Training Levy (NITA): KES 50.00
- NSSF Tier 1 Contribution (Employer): KES 480.00
- NSSF Tier 2 Contribution (Employer): KES 3,840.00
Subtotal: 1,200 + 50 + 480 + 3,840 = KES 5,570.00
Monthly Maintenance Costs:
- Private Insurance: KES 2,000.00
- Office Space: KES 10,000.00
- Company Laptop Depreciation: KES 5,000.00
Subtotal: 2,000 + 10,000 + 5,000 = KES 17,000.00
Subtle Costs:
- Leave Days: KES 6,666.67 (equivalent to about 1.75 days per month)
- Sick Leave: KES 3,809.52 (roughly 1 day per month)
Subtotal: 6,666.67 + 3,809.52 = KES 10,476.19
So here’s the real cost breakdown: while Nelly is cutting Chepsi a monthly gross salary of KES 80,000, that’s just the tip of the iceberg. Behind the scenes, she’s also footing additional bills.
First, there are the mandatory government contributions, things like NSSF, NITA, and the housing levy which total KES 5,570 per month. Then there’s the maintenance overhead of keeping Chepsi in the game: KES 2,000 for private health insurance, KES 10,000 for office space, and a KES 5,000 monthly depreciation cost on the company laptop. That’s KES 17,000 right there.
And it doesn’t stop there. Even when Chepsi isn’t actively working, say he’s on leave or under the weather the business still bears the cost. Those subtle but real expenses add up to KES 10,476.19 a month, from paid leave and sick days.
So when you do the math:
KES 80,000 (salary) + 5,570 (government) + 17,000 (maintenance) + 10,476.19 (subtle costs) = KES 113,046.19
That’s the actual monthly price tag of employing Chepsi a whole KES 33,046.19 more than what’s on his payslip.
Compensation structures for revenue-generating employees and cost center employees often differ. Revenue folks usually enjoy performance-based perks like monthly sales commissions while cost center teams tend to have more fixed structures. Different teams, different math.
Increments and Bonuses
Now that we’ve broken down how companies calculate your total worth including all those hidden costs, let’s talk about how they decide to “reward” you. And by reward, we mean pay increments and bonuses or in Chepsi’s case, why they chose to give him a KES 3,500 Naivas voucher.
Welcome to the world of performance reviews, the corporate ritual where your fate gets sealed in a spreadsheet.
Most companies conduct either annual or semi-annual performance reviews. Your direct manager is expected to evaluate your entire year’s work, and rate you on a scale, usually something like this:
- 1 = Low Performer / Does Not Meet Expectations
- 2 = Below Average / Needs Improvement
- 3 = Average / Meets Expectations
- 4 = Above Average / Exceeds Expectations
- 5 = Outstanding / Rockstar Performer
On paper, it seems fair. But here’s the twist: once your manager submits their rating to HR, the game changes.
The Bell Curve Reality
Behind closed doors, there’s a lesser-known process called performance calibration. This is where senior managers and HR sit together to compare ratings across departments without your direct manager necessarily present.
The goal? Fit everyone into a bell curve.
Let’s say your department has 10 employees, and everyone genuinely performed well. In an ideal world, all would be rated “Above Average” or better. But in calibration, not everyone can win, regardless of their actual performance. Companies will force the distribution to look like this:
- 1–2 employees as “Outstanding”
- 2–3 as “Above Average”
- Majority as “Average”
- A few as “Below Average”
- At least 1 as “Low Performer”
Why? Because budgets for raises and bonuses are limited. Calibration is essentially a budgeting mechanism masked as a performance process. Once you’re placed in a category, that rating becomes your ticket (or not) to an increment or bonus.
Essentially if your manager ranks you as a 3 (Meets Expectations) you are more likely to move to a 1 (Low Performer) than to a 4 (Above Average) to balance the curve, your pay raise could disappear altogether.
So Why Did Chepsi Get a KES 3,500 Voucher and Not KES 2,000?
Let’s unpack the math and logic behind that decision.
From Chepsi’s tweet, we know he was part of a pre-launch startup and had contributed significantly, possibly building the Minimum Viable Product (MVP). He also mentioned the startup had generated about $1 million in revenue that year, which converts to roughly KES 129,000,000 using an exchange rate of 129 KES/USD.
Now, let’s break down how startups typically allocate resources when they’re lean, pre-product-market fit, and running on limited cash.
Let’s say the company decides to allocate 10% of its annual revenue toward people-related costs beyond base salaries things like bonuses, salary increments, and new hires. If the company made KES 129 million in revenue that year, that gives us a KES 12.9 million pool to work with.
Now, that 10% isn’t written in stone. It swings depending on a few things like how generous your CEO is feeling that quarter, stingy the CFO is, or whether the company just raised a round and now has a board of VCs who want to cash out real quick.
And if you’re at a venture-backed startup? Let’s just say allocating money to “people’s happiness” has to be pitched harder than the product itself. Every bonus or raise turns into a slide deck and a “please sir, may I have some more?” moment in front of the board.
So while 10% is a decent benchmark, in real life it often comes down to politics, persuasion, and pure vibes.
In early-stage startups such as where Chepsi was working, this budget is usually distributed based on urgent priorities:
- 60% for key hires and team expansion (7.74 million) focusing mainly on revenue generating employees.
- 25% for salary adjustments (3.225 million) for current employees and team motivation
- 15% for bonuses or “performance gifts” (1.935 million) for vibes and inshallah
Let’s say the team has 20 employees. Now we bring out what HR folks (and secretly the finance team) call the Bonus Multiplier Chart. This is where your final calibrated performance score starts to have very real consequences. Remember that number from the review form? The calibration score, It’s back only now it’s got cash tied to it.
Here’s what a standard performance-based bonus multiplier table looks like:
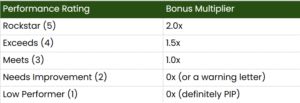
Now here’s the twist: your level in the company also affects your bonus. Because naturally, a senior engineer and a junior ops intern won’t get the same 1.5x multiplier even if they both got a “4” on performance. That’s where role weightings or grade multipliers come in.
Let’s build a more complete picture of a multiplier chart:

For most CXOs and very senior managers, bonuses aren’t left to chance they’re baked right into their contracts. Some even negotiate quarterly bonus structures (yes, quarterly I know someone who pulled that off). As for CEOs, their bonuses usually aren’t decided by the management team; they’re determined by the board of directors, based on performance targets like company growth, profitability, or fundraising milestones.
When you reach those levels, bonus discussions become less about surprise rewards and more about negotiated guarantees.
So if you’re Chepsi, a junior team member at a pre-launch startup you probably got a “Rockstar” (5). That gives you a 0.3x performance multiplier, and at your level, maybe 0.3x of the bonus pool as the final weight.
Let’s plug in the numbers.
Assume the final group of employees looks like this after performance calibration:

That gives us a weighted bonus multiplier sum:
Entry-Level:
- 1 × 0.3 (Rockstar) = 0.3
- 2 × 0.2 (Exceeds) = 0.4
- 5 × 0.1 (Meets) = 0.5
- 1 × 0.0 (Needs Improvement) = 0.0
- 1 × 0.0 (Low Performer) = 0.0
- Total = 1.2 units
Mid-Level:
- 1 × 0.5 = 0.5
- 1 × 0.4 = 0.4
- 3 × 0.3 = 0.9
- 1 × 0.0 = 0.0
- Total = 1.8 units
Senior/Manager:
- 1 × 1.0 = 1.0
- 2 × 0.7 = 1.4
- 1 × 0.0 = 0.0
- Total = 2.4 units
CXO Level:
- 1 × 2.0 = 2.0
- Total = 2.0 units
Total Bonus Weight
1.2 (Entry) + 1.8 (Mid) + 2.4 (Senior) + 2.0 (CXO) = 7.4 units
Bonus Value per Unit
Total bonus pool = KES 1,935,000
1 bonus unit = KES 1,935,000 / 7.4 = KES 261,486
For Chepsi’s case if he scored a 5 (Rockstar), he qualifies for a 0.3x bonus multiplier.
That means:
- Bonus units: 0.3
- Bonus earned: 0.3 × KES 261,486 = KES 78,446
There are several ways to calculate your eligible bonus. Some methods link it directly to your monthly salary or annual compensation. I went with this version because, frankly, it makes the most sense and more importantly, it’s politics-proof. No room for office favorites or whispered backroom math here, just cold, clear logic.
But here’s the thing: this is the theoretical gross bonus allocation. In many startups, especially pre-launch ones:
- Bonuses are partly deferred (especially if cash is tight)
- Sometimes they’re given as vouchers or gifts
- Taxes eat into cash bonuses
- And often, the actual amount is capped or standardized (i.e. “everyone under X level just gets a fixed KES 3,500 or equivalent gift”)
Conclusion
So while Chepsi’s “mathematical bonus” may be ~KES 78,446, his actual disbursed bonus could easily have been capped at KES 3,500 in the form of a shopping voucher. It’s not about what you’re worth. It’s about what the company can afford to pay without raising eyebrows at the next investor update.
For startups still chasing product-market fit, cash bonuses are as rare as a stable burn rate. Instead, many lean teams opt for non-cash rewards think, team lunches, shopping vouchers like Chepsi’s, or the classic startup starter pack: branded t-shirts, backpacks, and the occasional company-branded hoodie.
Why not just give cash? Well, in Kenya, cash bonuses are subject to PAYE of up to 30%, meaning they cost the employer significantly more. On the other hand, employee events and gifts can be classified as business expenses, making them more tax-friendly under KRA guidelines. Cheaper for the company, still mildly exciting for the team, it’s a win-win-ish.
Honestly, reading this made me think about how little financial education employees get before joining a startup. If more people understood the real dynamics between revenue, costs, and compensation, there would probably be fewer horror stories like the ones you shared.